QuantumCat/Features/Charts & drag-to-trade
Charts
The chart is the cockpit.
TradingView's chart on your own broker's tape — where the stop is a line you drag, the drag moves the real resting order, and a refused move snaps back instead of lying.
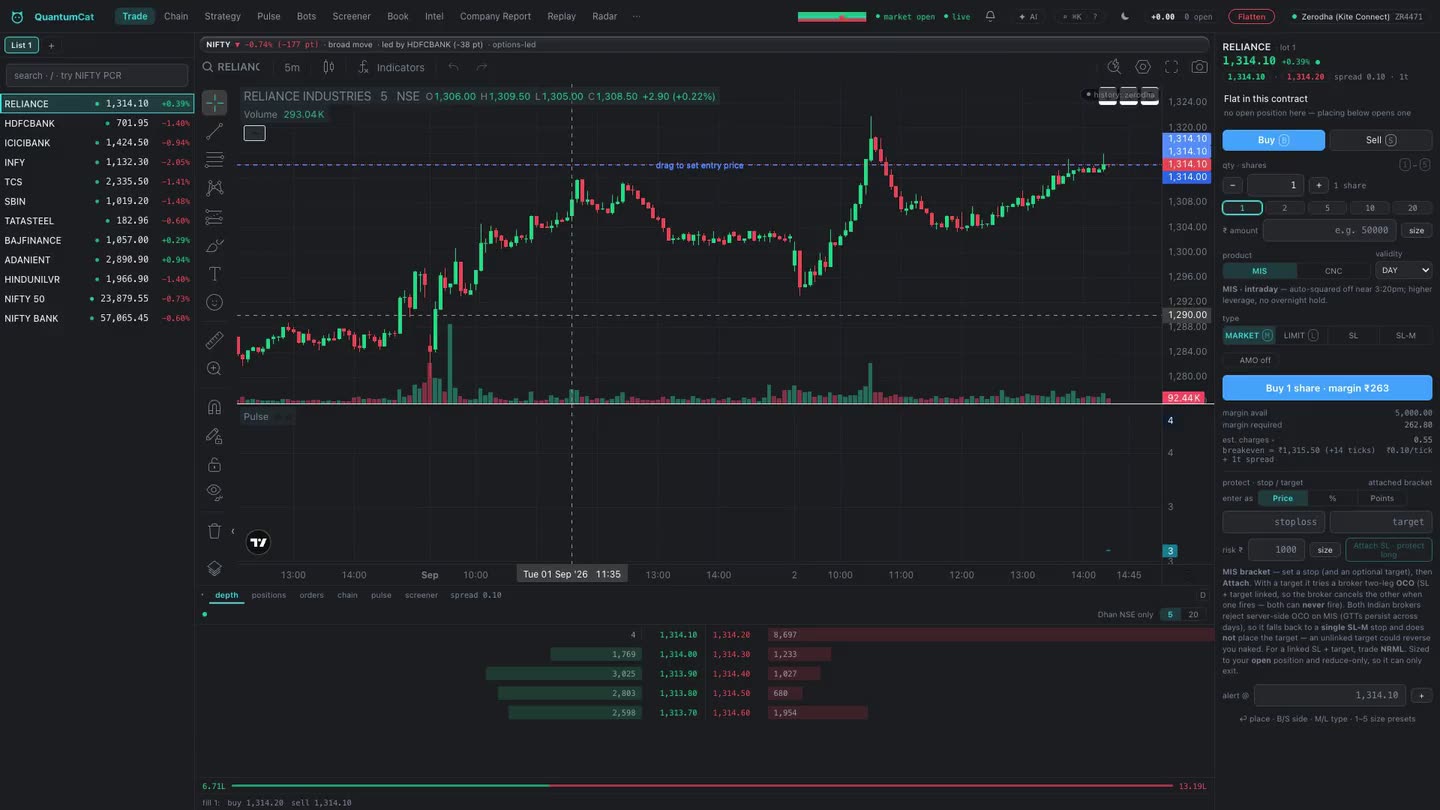 Charts & drag-to-trade · real build, recorded live
Your broker's tape, on TradingView's chart
The chart is the licensed TradingView charting library, fed by your own broker's candles and your own live ticks — not a third-party data vendor's approximation of them. The bar you see forming is built from the same tick stream your orders route against, on the same session grid (NSE 09:15, MCX and CDS 09:00), so a level you draw is a level your fills relate to.
Drawings, indicators and the timeframe persist per instrument. The chart blends into the window rather than sitting in a box — a deliberate constraint the app holds itself to, in both themes.
Trade by dragging
With drag-to-trade on, your stop-loss and target are lines. Drag one and the app doesn't just redraw it — it moves the resting broker-side GTT, in place where the broker supports a modify, and by a confirmed delete-then-create where it doesn't. It never leaves two live stops on one position: if the delete is refused, the create does not run, and the existing stop stays exactly where it was.
- A refused move is refused visibly. If the broker rejects the change, the line snaps back to where protection actually rests — it never sits at a price nothing is armed at.
- Both lines together become one OCO where the broker supports it, so the first to fill cancels the other.
- The confirm card shows the real numbers — trigger, the limit that will actually rest behind it, quantity and side — before anything is sent.
Entries from the chart
Drop a level to stage a limit or a stop entry. The side is always explicit — never inferred from where you dropped it. A stop-limit's cushion is capped at 100 ticks rather than a flat percentage, because on an index future a “0.25%” cushion is over a thousand ticks of slippage, and the resulting limit is displayed next to the trigger so you see the price it can actually fill at.
A stop-market entry, or a limit already priced through the tape, is blocked while the feed is disconnected or the tick is stale — an entry never reduces risk, so there is no exception for it.
The rest of the cockpit
| Overlay | What it does |
|---|---|
| Trade lines | Live entry, stop and target for the open position, drawn from the broker's own numbers. |
| Order modify | Drag a resting order's price to modify it; a rejected modify restores the line. |
| Plan levels | The frozen Pulse plan — entry, stop, objective — drawn where they were decided, not recomputed as price moves. |
| Flatten | A reduce-only market exit for this instrument, two-click armed, that bypasses the entry risk gate — you can always get out. |
| Replay bar | Scrub a recorded session tick by tick, with the transport pinned over the chart. |
What the chart will not do
- It will not derive a price from a pixel without rounding to the instrument's tick. Every dropped level is snapped before it is sent.
- It will not arm an overlay against the wrong instrument. If the series and the focused symbol disagree, the overlays stand down rather than draw one instrument's levels on another's axis.
- It will not place anything silently. Every drag ends in a confirm card, and every confirmation states the account it will place on.